What is OTDR Block Diagram?
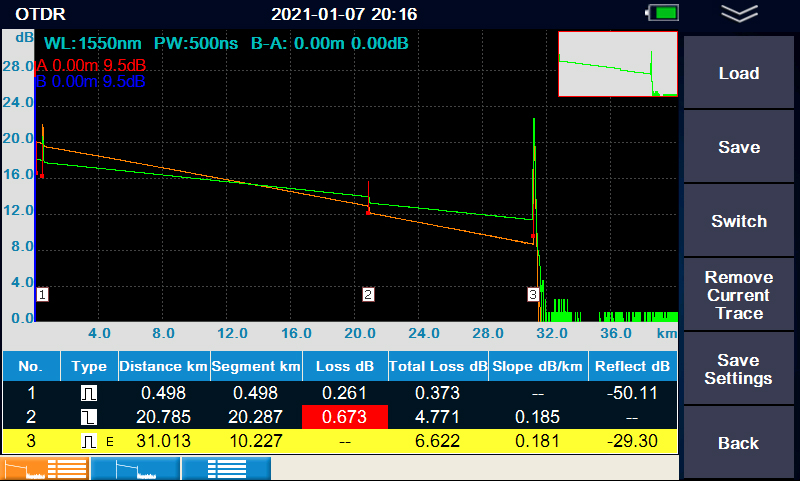
OTDR consists of a laser Diode, an Optical Sensor (APD), a Coupler/Splitter (or Circulator), a Controller, and a Display.
OTDR Block Diagram
Laser Diode:
On Command from the Controller, Laser Diode sends out light pulses. For different measuring distance and conditions (with or without fiber splitters for example), different pulse widths can be selected. The light goes through Coupler/Splitter (or Circulator) and then into the Fiber Under Test.
Coupler/Splitter (or Circulator):
Coupler/Splitter (or Circulator) has three optical ports: one for the Laser Diode, the second for the Fiber Under Test and the third one for the Optical Sensor (APD). Coupler/Splitter (or Circulator) only allows light to travel in specific directions from the Laser Diode to the Fiber Under Test, and from the Fiber Under Test to the Optical Sensor (APD). Light is not allowed to go directly from the Laser Diode to the Optical Sensor (APD).
Therefore, pulses from the Laser Diode go out into the Fiber Under Test, and the returning backscatter and reflections are routed to the Optical Sensor (APD).
Optical Sensor (APD):
The Optical Sensor (APD) is specially designed to measure the extremely low power level of the light backscattered from the Fiber Under Test. It converts the optical power of the backscattered light to a corresponding electrical level. The Optical Sensor (APD) has an electrical amplifier to boost the electrical signal level. The higher the optical power is, the higher the electrical level is.
The power of a Fresnel Reflection can be up to 40,000 times higher than that of backscatter, and sometimes is more than the Optical Sensor (APD) can measure, overloading the Optical Sensor (APD) and driving it into saturation. Whenever the pulse encounters fiber end, mechanical splice, or connector coupling, it causes the Optical Sensor (APD) to be blinded for as long as the pulse occurs. This blind period is known as “Dead Zone”.
Controller:
The Controller is the brain of OTDR, which tells the Laser Diode when to pulse, gets the power levels from the Optical Sensor (APD), calculates the distance to scattering and reflecting points in the fiber, stores data points, and sends the information to the Display.
The Controller has a very accurate clock circuit, which a major component and used to precisely measure the time difference between when the laser pulses and when the Optical Sensor (APD) detects the backscattered light.
The round-trip distance is calculated by multiplying the round-trip pulse travel time by the speed of light in fiber, which is the speed of light in free space corrected by Index of Refraction). The measured fiber distance is half of the round-trip distance.
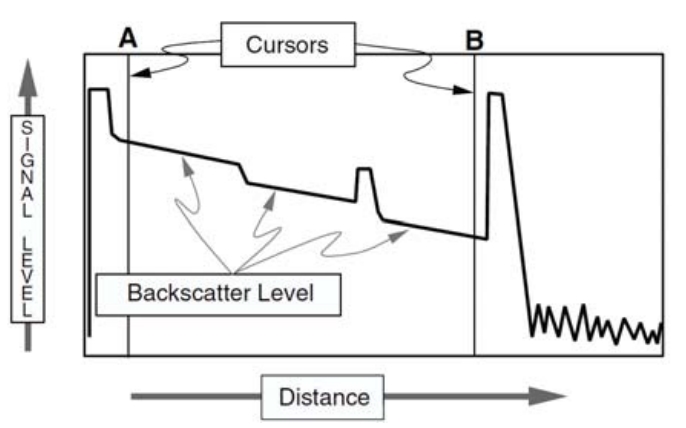
Since backscattering occurs all along the measured fiber, there is a continuous flow of light back into OTDR. The Controller samples the level measured by the Optical Sensor (APD) at regular time intervals to get its data points. Each data point is described by its sequence time and power level. The original pulse gets weaker as it travels down the fiber due to Rayleigh Scattering caused loss, therefore the corresponding backscattered level gets weaker down the fiber. Generally the data points have decreasing power levesl from fiber start to fiber end. But when a Fresnel Reflection occurs, the power level of the corresponding data point for that location suddenly goes up to its maximum level.
When the Controller gathers all its data points, it shows the information on the display. The first data point is showed at the left edge of the curve as the fiber start. Its vertical position is based on its backscattered power level. The higher backscattered power level, the higher point on the curve. Subsequent data points are placed to the right. The curve is a sloping line that runs from the upper left to the lower right. The slope indicates fiber loss per unit distance (dB/km) value. Steep slopes mean larger dB/km values. A sudden shift of the backscatter level indicates the Fresnel Reflections where light is escaping, like fiber end, mechanical splice, or connector coupling.
Display:
The display is a LCD screen which shows OTDR setting parameters, testing curve and testing results (2-point loss, distance, total loss, slope dB/km, Splice loss and Reflectance) . You can move cursors on the Display to select any point on the fiber curve. There are two cursors (Cursor A and B) will display the distances to each cursor and the difference in backscatter levels between them.